Introduction
What is the vision?
About Hydrific
Hydrific is a New York-based startup with a core belief that water is a fundamental resource. Committed to empowering individuals, utilities, and communities, Hydrific focuses on fostering water sustainability through innovations like smart home devices and by educating people about hidden water usage habits, along with practical tips to incorporate conservation into daily life. Backed by the global reach and expertise of LIXIL a global maker of pioneering water and housing technologies, Hydrific's vision extends beyond empowering consumers – it aims to change how we think about and use our water. Aligned with LIXIL's newly updated Impact Strategy, Hydrific will directly contribute to LIXIL’s broader Water Conservation and Environmental commitments.
logo
founded in
2021
funding raised in kickstarter
$114k
WHAT NEEDS TO BE SOLVED?
U.S. water consumption is on an unsustainable trajectory
In the past 50 years, U.S. water consumption has tripled even as the nation grapples with climate change and aging infrastructure. By the end of year 2024, 80% of the states were experiencing water shortages.
where is the demand?
California’s water scarcity & challenges
California faces chronic water scarcity driven by an expanding population, agricultural demands, and climate change. With up to 80% of its precipitation in the north but most of the demand in the south, managing resources is a constant struggle. Groundwater overdraft of 1-2 million acre-feet annually exacerbates the problem, leading to land subsidence and reduced aquifer capacity. Declining Sierra Nevada snowpack and over-reliance on external sources like the Colorado River further highlight the urgency of addressing the state’s complex water challenges.
Californians use around
40%
of their home water in landscape watering
from the state’s total area
32%
is experiencing droughts
average loss of water is
50%
due to leaks and aging infrastructure
Reduced Colorado River supply
1.5-2.5
* maf/year will likely be needed
due to changing climate
1-3
* maf/year is lost in increased evaporation
Overdraft of groundwater is
1-2
* MAF/year leading to subsidence
* MAF = Million acre-feet
WHOM DOES THE PRODUCT TARGET?
An average U.S. household
Hydrific conducted extensive research into the profiles of their customers, using both qualitative and quantitative surveys and questionnaires. We began to build a comprehensive picture of the ideal customer from various perspectives, including their cultural background and depth of understanding of water usage.

Water consumption
Each American uses an average of
310
Liters of water a day at home
Each U.S. household uses an average of
1100
Liters of water a day

Leaks & appliances
on average
20-50%
of all water is lost to leaks
U.S. HOUSEHOLDS lose
3 trillion
liters of water to leaks every year
a leak increases water consumption by
40-100%
FOR AN average household

Consumer behaviour clashing with environmental reality
Americans use
115%
more water daily than Europeans
Americans use
226%
more water daily than Asians
The Approach
What did we want to achieve?
Identifying the principal customer needs and the pain points of the experience
The strategic goal of Hydrific was to establish a digital user interface for its physical IoT water monitoring device, designed specifically for U.S. households. To achieve this, it was crucial to adopt a customer-centric approach to understand the type of digital solution U.S. households would prefer. Given that traditional water usage monitoring methods were far from fail-proof and widely disliked by customers, it became clear that a mobile service providing added value would significantly enhance the overall user experience.
Recruiting interviewees to map water usage habits
We began by recruiting participants from average U.S. households to better understand water usage habits. This allowed us to identify key touchpoints throughout the experience. Through this targeted recruitment, we uncovered pain points and areas in need of improvement.
Discussing & prioritising assumptions to clarify our focus
We outlined and discussed our assumptions about water usage behaviors, such as the belief that customers lacked sufficient clarity about their water consumption. By engaging interviewees in this discussion, we validated these assumptions and identified a strong desire for real-time access to water usage data. Addressing this need would not only enhance the customer experience but also empower households to plan better, reduce costs, and minimize their environmental impact.
Asking open-ended questions to validate assumptions and prototype solutions
During interviews, we focused on open-ended questions to gather deeper insights and validate our hypotheses. We shared an easy-to-understand prototype, which confirmed customer interest in understanding overall water usage, receiving alerts about potential leaks, and accessing both real-time and historical data. Customers also expressed a need for clarity, given the complexity introduced by different faucet types. Their feedback helped us refine our solutions and prioritize features that would have the greatest impact.

what were the holistic conclusions?
The Insights

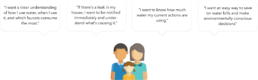
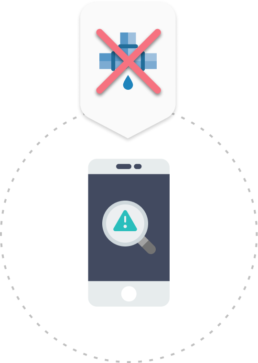
Detailed water consumption data is not available
Consumers lack a clear understanding of how much water they use, when peak usage occurs, and which faucets consume the most. Most importantly, the only feedback they receive is a water bill, which provides no detailed breakdown.
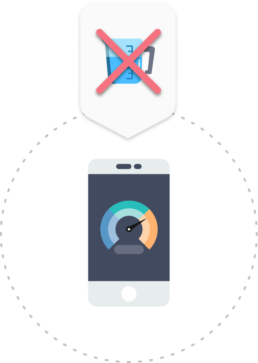
Water consumption is highly cyclical and predictable
Like many other human routines and behaviours, water usage follows a cyclical pattern on daily, weekly, monthly, and yearly bases. This creates an opportunity to predict future usage based on historical data.
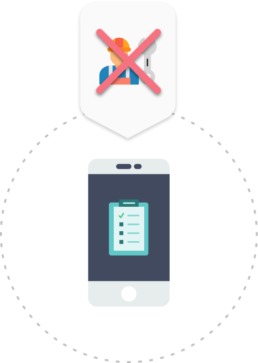
Leaks can go unnoticed for a long time, but once discovered, they can cause significant damage to both your property and finances
Leaks are often detected too late, after the damage is already done. Many households lack sufficient insurance to provide financial support in such situations.
Big environmental impacts begin with small actions
Saving even a small portion of personal water consumption can have a significant global impact. This can be achieved through a bottom-up approach, where technology disrupts the current status quo by democratizing access to water usage data, traditionally controlled by utilities.

The Concept
WHAT DO U.S. HOUSEHOLDS WANT FROM THEIR experience?
The 4 principal customer needs
What issues were present in the customer experience?
The pain points of U.S. households

the idea & solution
Changing water consumption habits through awareness and learning
Dashboard displaying water usage history and detailed usage breakdown
The difficulty in understanding overall water consumption stems from a lack of feedback and detailed breakdowns. A dashboard displaying water usage alongside a detailed breakdown could simplify the experience, enabling users to view their water usage history and identify which faucets consume the most.
Leak detection with machine learning and real-time leak alerts
At best, leaks cause an uncomfortable increase in water bills, but at worst, they can lead to significant property damage. By developing a leak detection system powered by machine learning, we can notify users whenever unusual water usage patterns are detected. Additionally, we can offer support to help users address and resolve these issues effectively.
Real-time monitoring of water usage
Consumers have little to no idea how much water their micro-actions, such as flushing a toilet or taking a shower, consume. By enabling real-time water usage monitoring, we can help them track and better understand their water consumption.
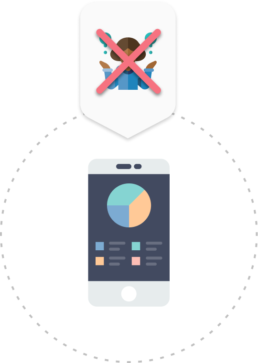
Easy installation process with step by step guidance
To install a water monitoring device in their homes, consumers often had to rely on external help and expertise, creating a barrier to adopting eco-friendly actions. By developing a device that eliminates the need for external assistance and simplifying the installation process to make it accessible to everyone, we could make a significant impact.
The Execution

Dashboard
The dashboard effectively uses a clear and intuitive navigation system at the top, allowing users to switch seamlessly between time frames. The information is presented in digestible chunks, with each view focused on a specific period, ensuring clarity. Key metrics, such as total usage, averages, and trends, are prominently displayed with appropriate labels, making the data easy to interpret.
Users can click on each tab to view the water usage for that time period
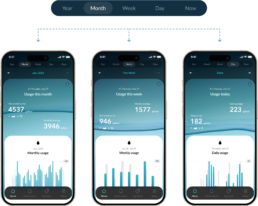
Users can tap on a data point to drill down and view more detailed water usage information.
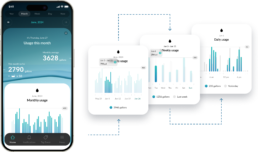
Users can scroll down to see the detailed breakdown of their water usage
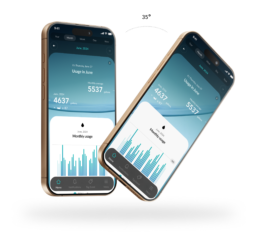
Visual Concept
Water’s liquid form follows function by adapting to its container and environment. In a glass, it takes the shape of the glass. In a river, it flows along the path of least resistance. This concept could be applied to a video background that adjusts to the viewing angle in hand and a water level indicator that reflects usage levels. The goal was to create a visually striking and easily memorable visual design for the U.S. market that leaves a lasting impression.
Leak Detection
The average leak can lead to costly repairs and significant damage to a home. Even a small amount of water can cause extensive financial and structural harm. With thousands of homeowners dealing with water emergencies daily, Droplet offers real-time leak detection to help prevent expensive repairs, severe damage, and unexpected crises.
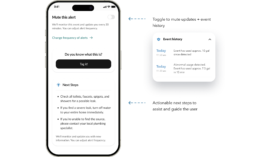
Users will be notified of an abnormal water usage event, along with its severity, when it is detected.
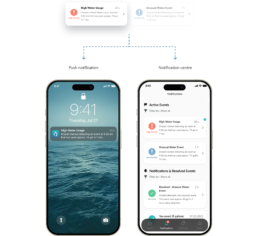
Users can view details of each alert, including volume, duration, and flow rate of the event.
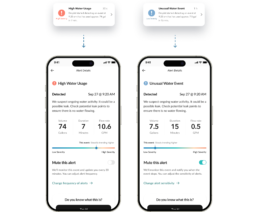
Users can choose to receive updates about events and will have actionable next steps to assist them.
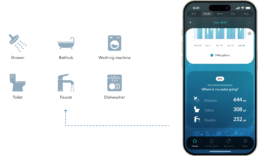
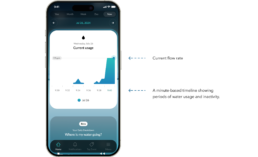
Real-time Water Usage Monitoring
Through real-time water monitoring, consumers gain valuable insights into the specific amounts of water their everyday micro-actions—such as flushing a toilet or taking a shower—actually consume. This technology empowers individuals to track, analyze, and better understand their water usage patterns, enabling more informed and sustainable decisions in their daily lives.
Users can view the current water flow rate on a minute-based timeline
Easy Installation Process
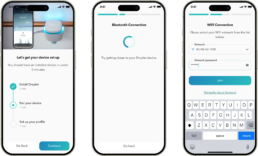
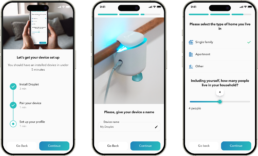
The setup is seamless and intuitive, from easy account creation to guided device placement. Effortless Bluetooth and Wi-Fi integration ensures quick connectivity, while personalized profile inputs refine performance. Designed for simplicity and efficiency, the process delivers a smooth user experience.
Users can easily set up their accounts

Users are provided with instructions on how to locate the placement spot for the physical device
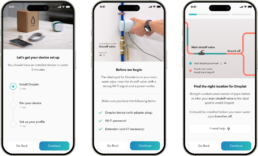
Users are guided on how to set up their bluetooth & wi-fi connections

Users enter their profile information, such as the type of home and the number of occupants
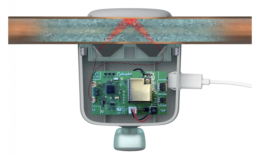
Physical device & installation
The Droplet device uses dual-ultrasonic sensors, allowing it to "see" through pipes. This innovative approach makes installation a breeze compared to legacy devices that require cutting pipes in half and installing the device in between.
How did it all go?
The Results
The Droplet app empowered users to save water efficiently and conveniently. It increased engagement, provided valuable insights, and made it easier for users to adopt sustainable practices.
Estimated average water saving rate
15-30%
of U.S. household total water consumption
Total save estimation
643
million litres of water in the first year
Kickstarter top
5%
performance
Number of backers
644
over
1,000
preorders
Awards

International Design Excellence Awards
Bronze Award

Honoree